You need to enable debugging support to do any practical interactive debugging.
Debug CODE
Debug Collabora Online Development Edition.
Since the steps provided below may vary depending on the platform and tools you are using, it is highly recommended for users to update and adapt the instructions accordingly to suit their specific environment. All are welcome to update this page.
With web browser
Introduction: Fortunately, modern web browsers come equipped with powerful debugging tools that make this process much more efficient. In this article, we will explore the steps you can follow to debug collabora online code when specific actions are performed.
About Dialog
There are a couple of things under “Help” → “About” that will help you test Collabora Online.
Triple click
In the About dialog left click three times to open a list, located on the top right corner, of all the important control layers toggles:
- Tile overlays
- Screen overlays
- Show Clipboard
- Always active
- Typing
- Tiles device pixel grid: Display the pixel grid in red. Essential when trying to understand why document looks blurry. E.g.: spreadhsheet cells, text, etc.
- Sidebar Rerendering
- Performance Tracing
- Protocol logging
- Tile dumping
The canvas area (document and surroudings) now displays, even if all toggles are off, a blue grid with some information in each square:
- wireID:
- invalidFrom:
- nviewid:
- requested
- rec-tiles:
- recv-delta:
- rawdeltas:
JS widgets
In the About dialog search for “JSDialogs: View widgets”. Click the link to open another dialog with all the javascript-based widgets. You can now test and see how all widgets look in one place.
Developer Tools
Open document: To begin debugging any document first open any document in localhost after
make run.To build collabora online please refer this blog Build CODEAccessing the Developer Tools: To begin debugging, you first need to access the developer tools in your browser. The exact method varies depending on the browser you are using, but typically, you can right-click on the webpage and select “Inspect” or “Inspect Element.” Alternatively, you can use keyboard shortcuts like F12 or Ctrl+Shift+I to open the developer tools.
Navigating to the “Sources” Tab: Once you have opened the developer tools, you will find a variety of tabs. Look for the “Sources” tab, which is commonly used for debugging JavaScript code. Click on it to proceed.
Identifying the File: In the “Sources” tab, you will see a list of files associated with the document you are debugging.You can also use
Ctrl+Pto open find source file in which you want to add breakpoint. Locate the JavaScript file you want to debug. If you are unsure which file is responsible for a specific action, you can use browser breakpoints or console logging to narrow down the search.Setting Breakpoints: Breakpoints are markers placed in your JavaScript code that pause its execution at a specific line. To set a breakpoint, navigate to the desired line of code within the JavaScript file and click on the line number. This action will set a red marker indicating the breakpoint.
Triggering the Action: Now, perform the action on the website that you suspect is causing an issue or want to investigate further. It could be clicking a button, submitting a form, or any other action that interacts with the JavaScript code.
Inspecting Variables and Debugging: When the action is triggered, the execution of the JavaScript code will pause at the set breakpoint. You can now inspect variables, step through the code line by line, and observe the program’s state. Use the various debugging controls available, such as stepping over, stepping into, or stepping out of functions, to navigate through the code and understand its flow.
Using Console Logging: If breakpoints alone are not sufficient for debugging, you can also make use of console logging. Inserting console.log() statements at key points in your JavaScript code allows you to output information to the browser’s console. This information can help you track the flow of the program, identify values of variables, and detect any unexpected behavior.
Using VSCode/dium
If you are trying to debug Collabora online using VSCode then probably first you need add this file in your .vscode code folder.
- launch.json
- Note:
- Inside launch file make sure url path will be same path as shown in terminal after
make run. - Please replace the variable ${Your-Work-Directory} with your collabora project directory path.
- Inside launch file make sure url path will be same path as shown in terminal after
To Start Debugging :
Do
make run.First put break points in files where you want to see the values or action to be carried out after some events.
Click on Run and Debug Icon :- You can find this icon in left side of your IDE.
Click on document type that you want to open and debug. For an example choose
writer. It will then launch the document in browser.
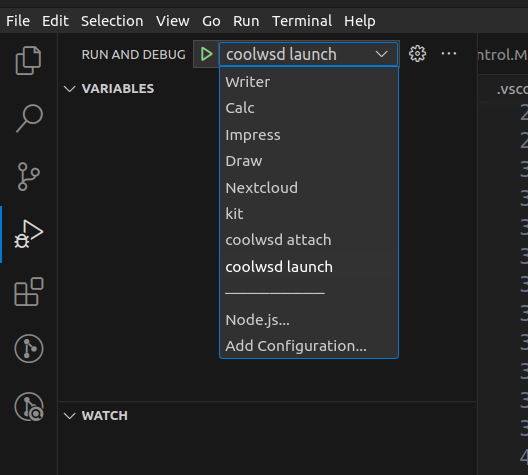
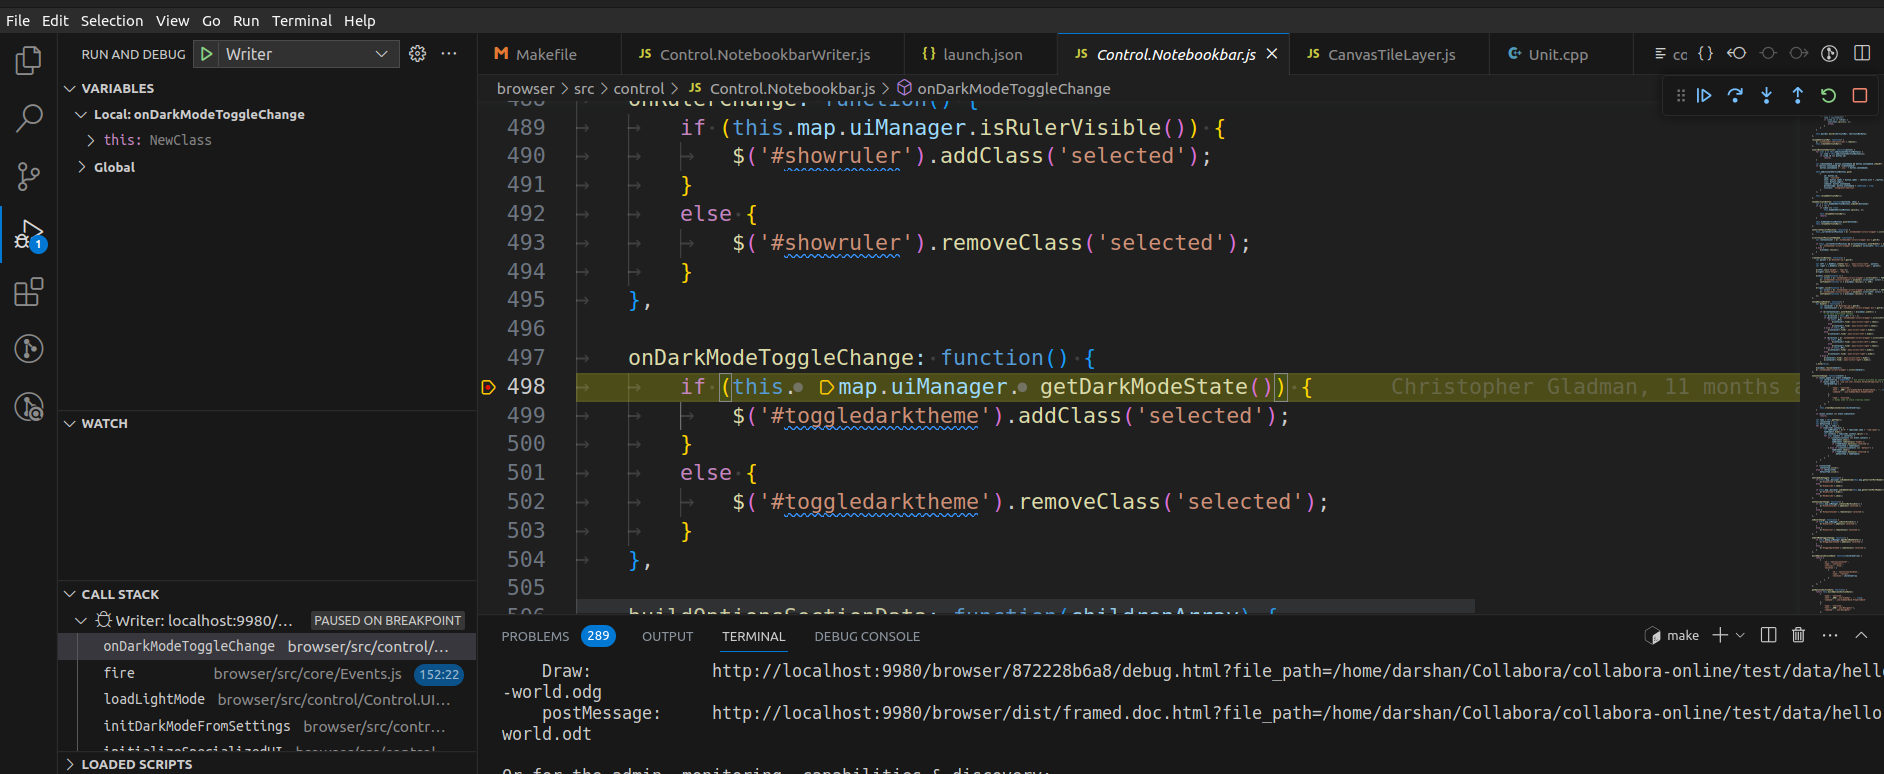
- after that you can perform any action. On the bases of your action break point will be hit and you can see the values of variables and code flow in your IDE. like this
GDB debugging for CPP files
When debugging, you want to pass --o:num_prespawn_children=1 to coolwsd
to limit the number of concurrently running processes.
When a crash happens too early, you also want to
export SLEEPFORDEBUGGER=<number of seconds>
or export PAUSEFORDEBUGGER=1
so that you have time to attach to the process.
Then run coolwsd, and attach your debugger to the process you are
interested in. Note that simply attaching gdb via gdb -p is not meant to work, your options are:
sudo gdb -p <PID>, which is easy to remember orgdb -iex "set sysroot /" -p <PID>, which can run as an unprivileged user, since we switched from capabilities to unprivileged namespaces.
You can make the later an alias as well:
alias cool-gdb='gdb -iex "set sysroot /"'
cool-gdb -p <PID>
Also, note that as the child processes run in a chroot environment, they see the LibreOffice shared libraries as being in a directory tree /lo , but your debugger does not. So in order to be able to effectively debug the LibreOffice code as used through LibreOfficeKit by a child coolwsd process, you need to symlink the “lo” subdirectory of a running child coolwsd process’s chroot jail as /lo. Something like:
sudo ln -s ~/libreoffice/master/cool-child-roots/1046829984599121011/lo /lo
Use the ps command to find out exactly the path to use.
Set COOL_DEBUG=1 to trap SIGSEGV and SEGBUS and prompt for debugger.
if you choose PAUSEFORDEBUGGER send the signal SIGUSR1 to resume the process
In order to run and debug one unit test, run the commandline that is printed when the test fails. To run one single CppUnit test from a suite, additionally use:
CPPUNIT_TEST_NAME="HTTPWSTest::testCalcEditRendering" <printed commandline>
Edit page
On android
Local or remote hosted on an android mobile device
Pre requisites :-
- Google chrome on android device and desktop
- USB cable for debugging
Steps:
Enable usb debugging on your android device (Various links are available for how to do this, am trying to reduce the scope here).
Open chrome in desktop and type chrome://inspect . We can see the devices in the network and the mobile device in devices
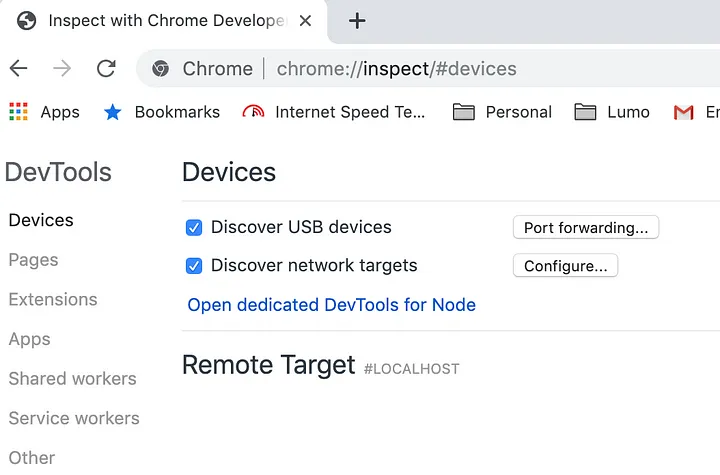
- Connect your android device via USB to the desktop. There may be a prompt on mobile for allow debug and allow that. You can see a new device is listed in devices list in chrome.
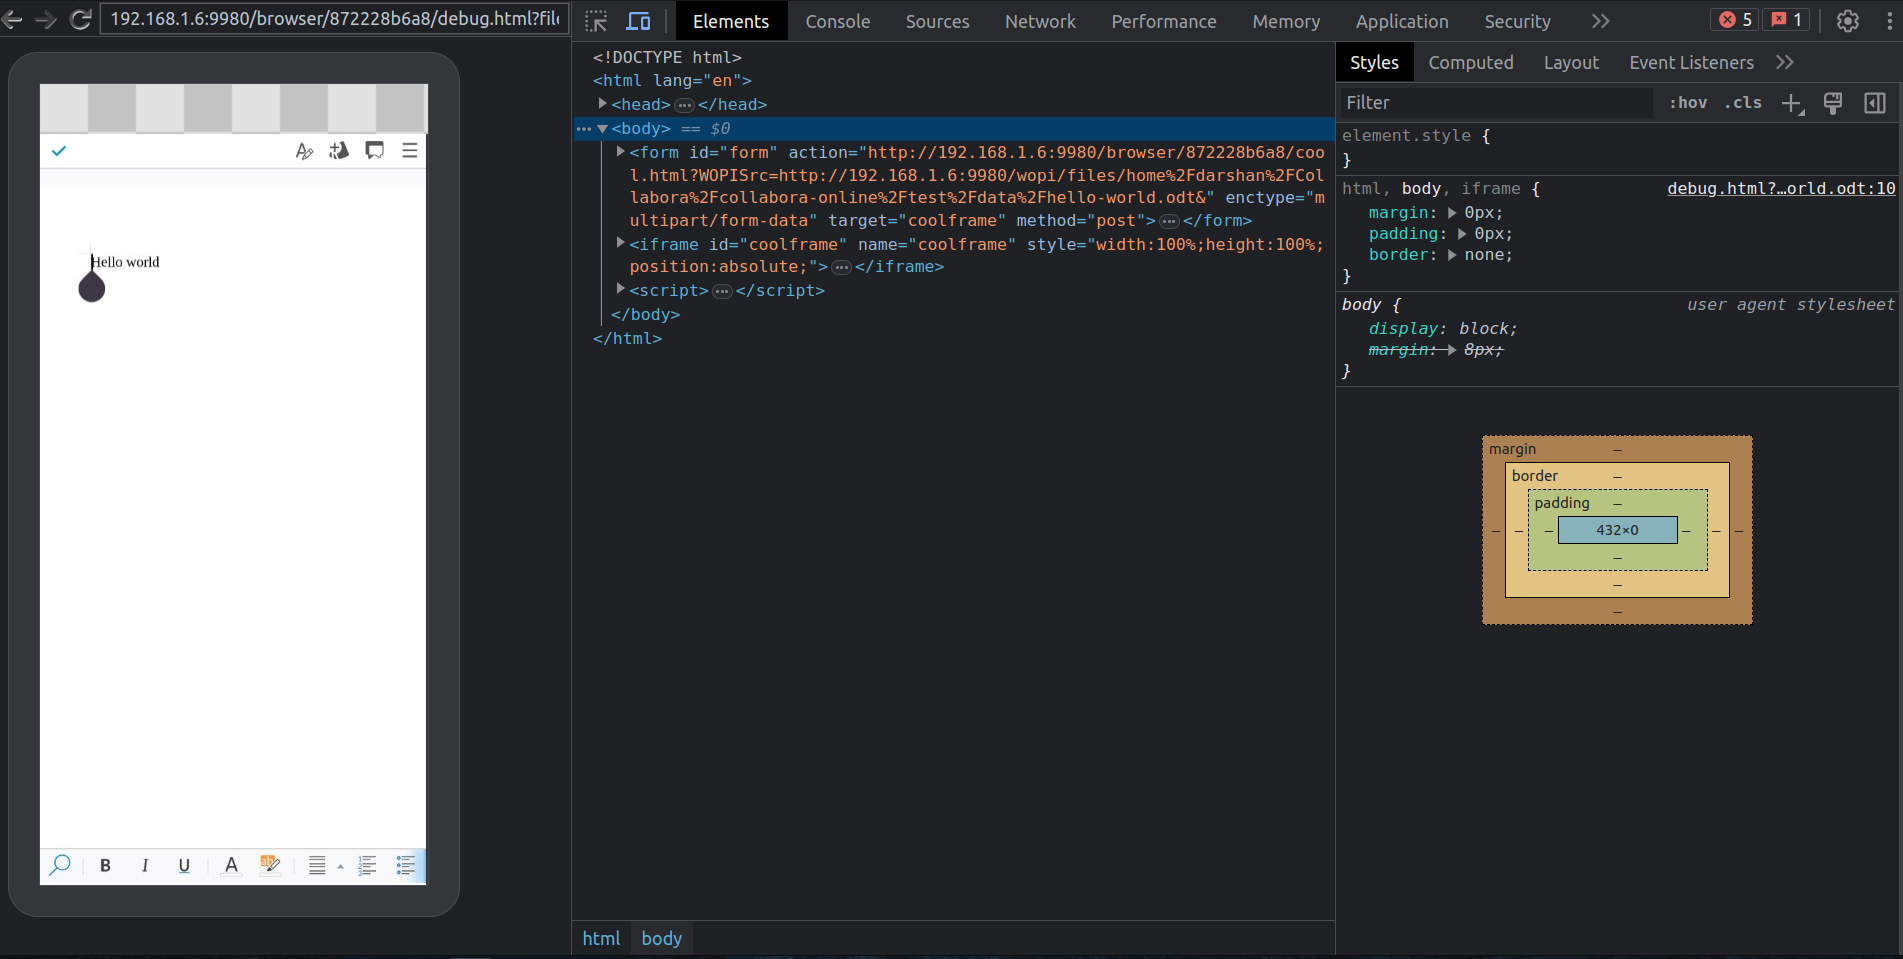
Now if we add a new tab or go to a website, the tabs and address will listed in desktop. Inspect link is right over there and click on that
This will open up a mobile screen cast and all the set of chrome dev tools options
Edit page

